Have Equities Markets Reached Their Apex?
It’s hard to make the case that equities markets are going to sustain a long-term bull run. The above graphic represents the performance of the Dow Jones Industrial Average since November 2017. In the run-up to the New Year, there was a spectacular rise in confidence from around 23,500 to 26,500, followed by plenty of whipsaw behaviour in the markets. If a bull trend was evident before 2018, the waters have been significantly muddied since then. Much of what we are seeing taking place in the financial markets is completely normal.
These price corrections are nothing more than a rebalancing of the financial markets. The value component of trading and investing is highlighted when equities markets correct. We saw this taking place in February 2018 when major indices like the Dow dropped from 26,000+ to around 24,000. Presently, the Dow Jones Industrial Average has retreated beneath its 50-day moving average of 24,766.62 and remains comfortably above the 200-day moving average of 23,506. Recent volatility hit the markets hard, but investors believe that there is fundamental value in the strength of US stocks.
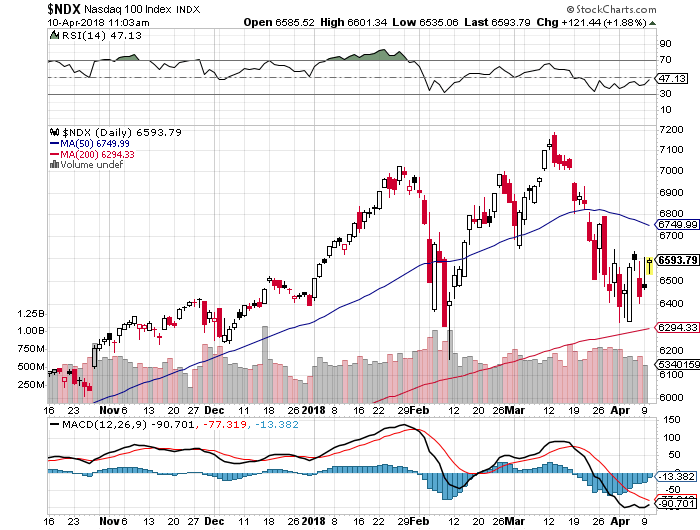
If we shift our attention to the tech laden NASDAQ 100 index, similar trends are evident. The NASDAQ also enjoyed a bull run heading into 2018, plunged spectacularly in February, and then began the inexorable process of rebuilding. Since then, the NASDAQ has been hit hard heading into Q2 2018, but a mini resurgence appears to be on the cards. As it stands, the NASDAQ 100 index is trading beneath the 50-day moving average of 6749.99, and comfortably above the 200-day moving average of 6,294.33. The patterns in both the Dow Jones and the NASDAQ are almost identical. A long-term bull run came to an abrupt halt in February 2018, followed by significant whipsaw behaviour ever since.
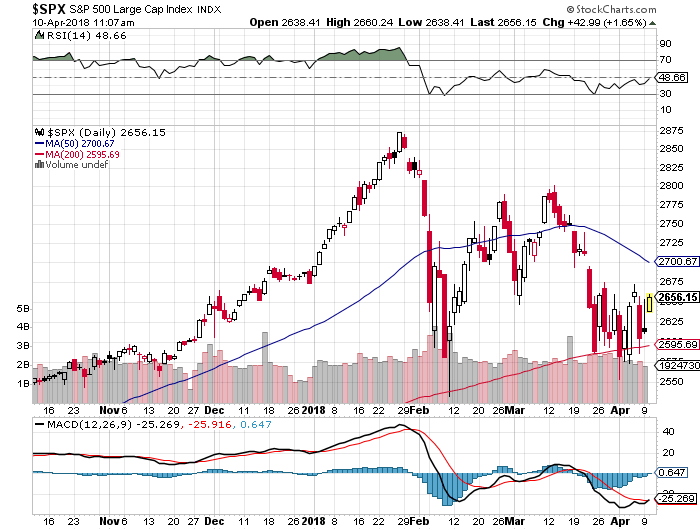
The S&P 500 index – the large cap index – is an integral element of the trading arena. This leading bourse reached towards 2,875 in 2018, before dropping towards 2,600. Once again, the same patterns can be gauged from the above chart. A long-term bull run was grounded by a dramatic price correction, followed by a steady consolidation over the past several months. The S&P 500 index is trading below the 50-day moving average of 2,700.67, and comfortably above the 200-day moving average of 2,595.69.
What Factors Are Driving Market Behaviour?
According to Olsson Capital trading analyst, Smythe Ellison Blackwell, there are many factors – intrinsic and extrinsic driving stock market prices:
‘When we look at the markets today, especially across all major bourses in the US, we see many commonalities. The Bull Run, the correction, and whipsaw activity since then. The more important question is why we are seeing these trends across the spectrum. It is entirely possible that what we are witnessing is a new paradigm in financial markets. Gone are the days where stock markets ticked up a few points in a day, held steady and gradually grew over time. We are now in an investing era where wild price swings are the order of the day. Consider that three of the largest drops in the Dow’s history – over 122 years – took place in 2018. Is this coincidence?
Methinks not.
This is part of new age tectonic forces rocking the financial markets. We see it in the cryptocurrency arena, and there’s absolutely no reason why traders and investors don’t speculate, buy and sell excessively in stock markets too. Consider that the S&P 500 index has had 27 trading days where price movements have been 1% or more. In all of 2017, there were just 8 days like that. This is clearly an era of change and we must all brace ourselves for the volatility that is bound to come.’